Greetings urban enthusiasts. I want to try something different this week. This is a deep dive review into one of the best books I read this year: Scale by Geoffrey West. It is a longer email than usual but could be a useful reference if you never get around to reading the book (which you absolutely should if you enjoy cities, science and complex systems). It is not a comprehensive account, but a summary of the most interesting points I highlighted while reading it. If you enjoy this kind of content let me know by replying to this email. You can always check out books I have loved or hated in my goodreads list. Because of the length of this issue some images might be truncated. For a better reading experience consider the web version this time around.
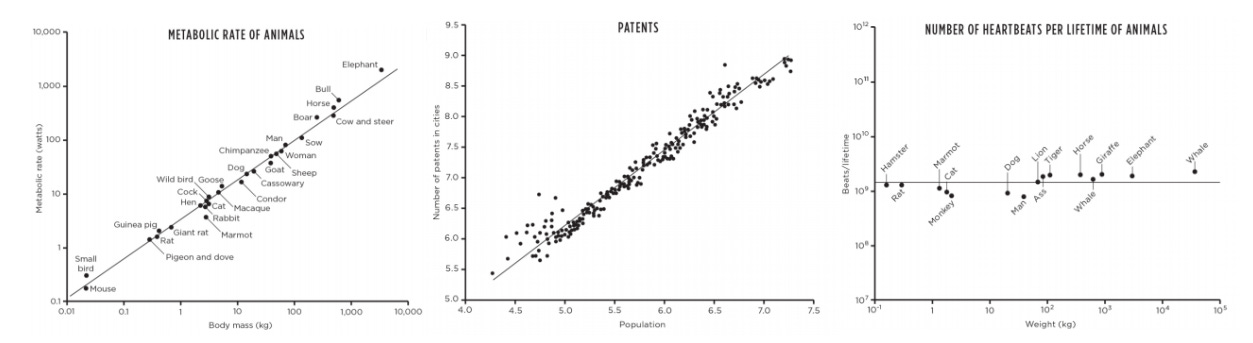
Scale is a fantastic book about the hidden order of seemingly random complex systems. It’s a practical interpretation of a variation of the law of large numbers to biological and social phenomena such as cities and economies. West’s distinguished career spans various fields - in Scale he tries to make the quantitative connections of complex adaptive systems clear and understandable to non-technical readers. The book delves on fascinating topics - and ultimately communicates the difficulties that are presented to human understanding by the very nature of exponential growth and complexity; his masterful narrative evokes images of Sagan’s Pale Blue Dot. It describes finite-time singularities and the naïve approach that we have had to open-ended growth for the past century. The grand point of the book is that there’s a clearly visible coarse-grained order that drives biological and social life. Brain size, metabolic rate, number of lifetime heartbeats, patent correlation to city population, are just a few variables that illustrate West’s argument of power-law scaling behavior.
Exponential Growth
Our current challenges feel like an impending tsunami because we are at a key point in our civilization’s exponential growth. Both world population and GDP growth have multiplied spectacularly since the industrial revolution. We seem to be approaching a point where more growth seems hard to fathom. The ceiling seems to be coming faster and faster at us. It is in the very nature of exponential expansion that the immediate future comes upon us more rapidly. It constantly accelerates.

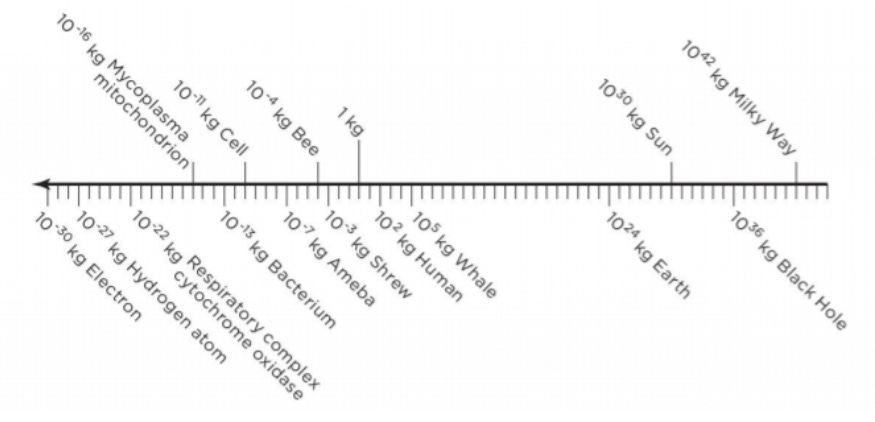
Our mind fails at comprehending the scale of exponential growth. The global economy has been on an exponential trajectory for the past 200 years. The one feature of this special kind of growth is compounding - at every cycle the system accelerates. West states how it is in the very nature of exponential compounding that “the future becomes the present at an increasingly more rapid pace, so much so that by the time a problem has arisen it’s often too late to address it successfully.” Exponential growth might be one of the reasons why the problems we are facing seem more complex at every turn, the crises that confront us seem larger, and catastrophe seems imminent. Despite crises and busts, GDP growth since 1800 has been on a pure exponential growth curve. Logarithmic scales have the power to illustrate the size of an electron as well as the whole universe in one simple image. Very interesting to see how on that scale there is a large gap between the blue whale and the size of the earth.
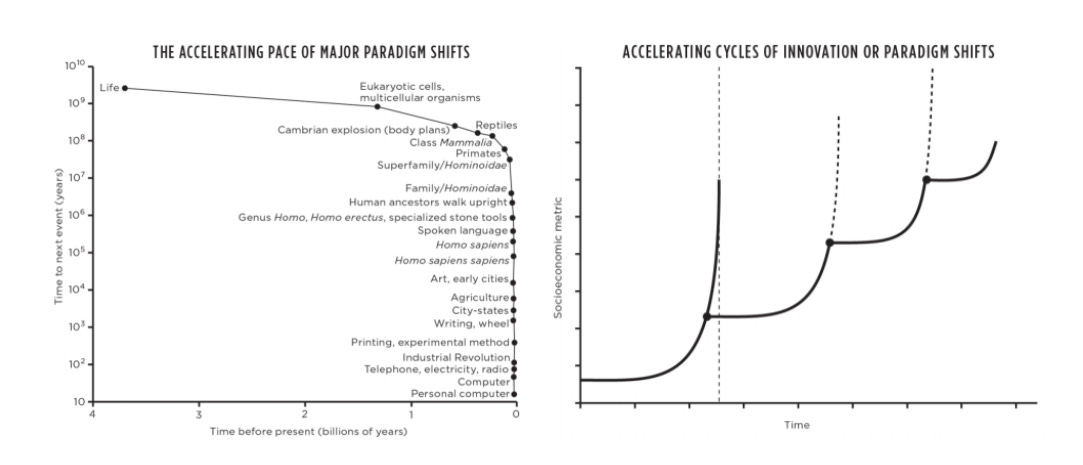
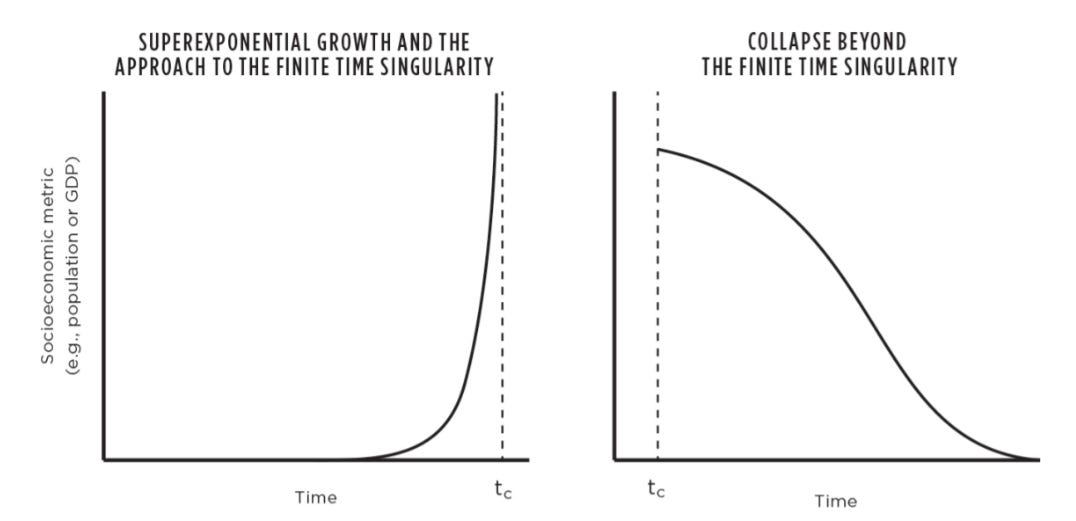
To keep this cycle of growth constant we need to increase both the pace and the scale of innovation. The following image illustrates the cycles of innovation and paradigm shifts we have gone through. It shows how the graph of exponential curves is itself an exponential curve on a long-enough time scale. This means that no matter how fast we are able to innovate at a certain point in the future it will be physically impossible to innovate faster, because at each cycle, the need for innovation remains constant, while it’s speed increases exponentially. It is possible that some yet unknown feature of innovation might be uncovered; we might invent a technology which eliminates material needs. Ultimately though the more plausible explanation is that we are approaching what is typically known in physics as a finite time singularity. This would mean that at the current rate of growth we would achieve infinite growth in a finite time. This is of course impossible. If our economic system behaves similarly to other complex systems, the typical explanation is that we will soon hit an insurmountable barrier; we will either constrain growth, stop growing altogether or collapse - we are approaching a phase transition.
A phase transition is a point in time where the growth paradigm is radically transformed. The Guardian calls our current times an age of extinction: a point in time where “animal populations have plunged an average of 68% since 1970, as humanity pushes the planet’s life support systems to the edge” Collapse might look similar to how water freezes or boils at specific temperatures. While our variable is time, in the case of water it is temperature. Below or above a certain temperature the structural properties of water radically change into ice or steam; underlying such familiar phase transitions are singularities in the thermodynamic variables characterizing the system. Theory explains the shape of the consequences of stagnation and collapse. What they would look like in reality however is hard to predict. What form an event of such magnitude might take has been the plot of hundreds of disaster or extinction Hollywood blockbusters. We do not know whether the collapse might precipitate a breakdown of the global economy, whether it might be war causing nuclear holocaust, an extinction level pandemic born of interconnectedness or hostile artificial intelligence.
Cities & Innovation
Cities make parsimonious use of infrastructure and service is provided more efficiently. There is a hidden order to the growth and efficiency of cities expressed through power-law scaling behavior. Bettencourt and West have identified proportional relationships between the size of cities and various indicators. Urban infrastructure and service provision for example exhibits a clear trend, scaling sublinearly at a slope of 0.85 related to city population. This means that every time a city doubles in population and therefore grows by 100%, its infrastructure needs grow by 85%. 15% of savings is attributed to economies of scale that are generated by human interaction. A similar behavior - but of a superlinear scale is observed in some socio-economic variables. Crime and wages scale superlinearly at a slope of 1.15. This similarly means that the growth of a city population by 100% will increase wages by 115% but will also increase crime by an equivalent degree. This power-law relationship of population to various indicators in cities is extensively described by research.

Maybe the most interesting example of these hidden laws driving the urban condition is walking speed. If you double the size of a city, individual humans walk 20% faster. We do not usually consciously command our walking speed but our urban environment will surreptitiously modulate it. We notice peers walking faster and we replicate. In response to this Liverpool has implemented express walking lanes for pedestrians. One counter-argument might be that the largest the city, the younger the population and therefore the faster the walking speed. Regardless it’s a pretty astounding correlation and it surreptitiously entertains a determinism versus free will discourse. The most important superlinear power-law urban indicator is innovation per capita. Here larger cities have the lead, with innovation per capita scaling at a factor of 1.2 related to city population. These economies of scale and universal power-law behaviors are the reasons why cities hold the key to a prosperous and possibly sustainable future.

GDP per capita is a fairly linear measurement - in a way it compares apples to oranges and does not take account of superlinearity, or increasing returns to scale. Population size increases brings about statistically relevant efficiency returns. Therefore economic performance indicators should take into account the inherent improved efficiency of cities. So the largest cities’ GDP should be measured in relevance to the expected performance rather than the actual performance. The useful challenge is to identify cities which are outperforming their expected efficiency related to their population. We need to figure this out because when measuring the performance of a city relative to its expected performance makes NYC an underperformer and Burlington a superstar.
Global interconnectedness gave us a shared world circulatory system. An international grid of connections, supply chains and transportation networks which has radically changed our perception of the world and the way we do business. The global infrastructure grid spans all the typologies of transportation - it integrates road, rail, sea and air routes. The practical grid breaks its designed Euclidian uniformity and, when perused, assumes the shape of an organic entity. It exhibits generic network properties found throughout nature:
- It is space filling meaning that it’s tentacles - at their lowest hierarchy - a road, a sidewalk, or a footpath serve all the invariant terminal units of the systems.
- The global infrastructural grid’s terminal units are for all intents and purposes invariant. This simply means that the highest resolution modules of the network, the terminal units - such as the houses, offices or warehouses - all have approximately the same size and characteristics.
- There are multiple feedback mechanisms that keep the system highly optimized. Traffic, accidents or bad weather often cause regional issues in the grid. These are typically resolved regionally, without impacting the grid as a whole.
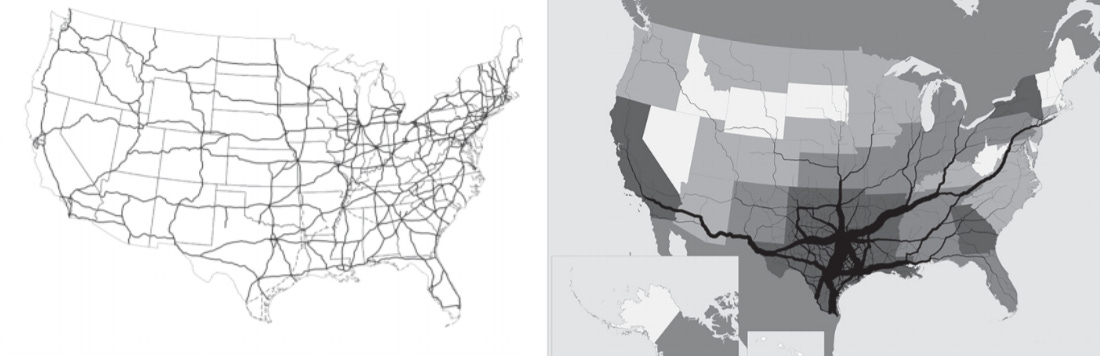 The following image is a comparison of the US Interstate Highway on the left, and Texas truck flows in 2010 on the right.
One good illustration is given by West through the US interstate grid. While its shape is that of a designed system with straight geometries (illustrated in the image to the left); it’s actual use - its essence - is much more organic and regionally oriented (illustrated in the image to the right). If we would zoom in at one of the warehouses that distributes goods regionally we would see a similar pattern. A lower-level Euclidian hierarchy of infrastructure and an organic grid of lower-level distribution through vans, taxis, automobiles or bikes. The global infrastructural grid is shaped by demography and designed top-down. It’s raison d’etre however - the fundamental reason for its existence, it’s very essence - is local mobility: from that perspective it looks much more fractal, complex and organic than expected.
Life, biology & morphogenesis
Consider that humans biologically consume 90W of energy - which is equivalent to the electricity required by a single lightbulb. Our social footprint - which includes the consumption of our devices, appliances, and mobility needs - is on average 3,000W; in power-hungry countries like the US it’s closer to 11,000W: this is equivalent to the energy needs of a blue whale, the largest mammal on earth. Currently, despite there being 7.6 billion people on earth, we operate as if there are more than 200 billion people. If, as it is currently predicted, the world population reaches 10 billion people by the end of the century, and all the humans of 2100 live at a standard comparable to the USA, then our effective energy footprint would at that point exceed one trillion people. Remember how 1 billion seconds were equivalent to 31.5 years? 1 trillion seconds are 31,709 years. 10 billion humans would tax the environment with the equivalent of 1 trillion individuals.
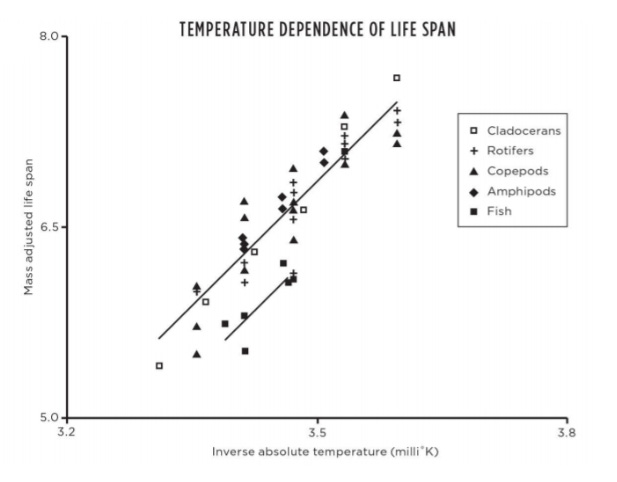
The carbon we currently release in the atmosphere is blamed for a measurable change in global temperatures. One extremely problematic point which is not discussed as often is the direct impact that temperature changes will bring to the longevity of organisms. A slight change in temperature can have important repercussions in metabolic rate and therefore mortality; a modest 2°C change in ambient temperature leads to a 20 percent to 30 percent change in the speed of growth and mortality rates. Global warming won’t just make it “a bit hot” - it will measurably shorten the lifespan of all living organisms.
Fossil fuels are like disposable single-use batteries. Imagine each tree as accumulated energy that has been compressed through fossilization. We learned to use our carbon batteries when we learned to use fire. We are stuck on this path-dependent process and are missing the renewable forest for the literal fossilized trees.
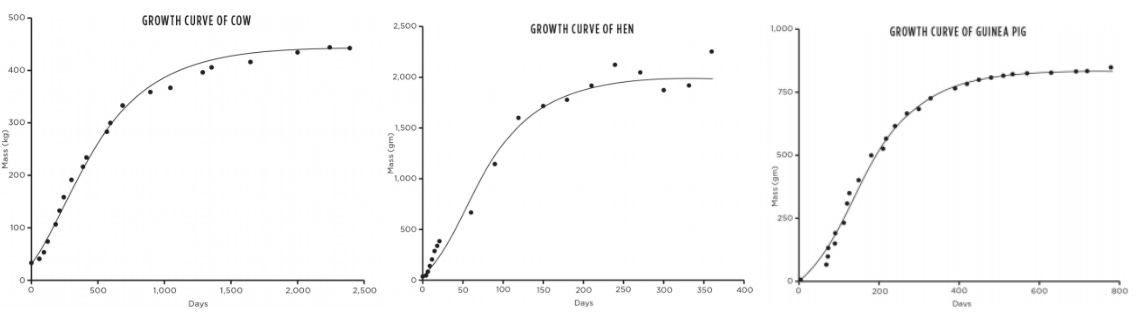
The growth curve for all animals is the same - at some point the energy devoted to maintenance drowns out any remnant that could be dedicated to further growth. It is interesting to note that further growth would probably look natural (it would be systemic - like a taller, larger man.) The interesting question therefore is whether humans can grow to as big a size as a blue whale - or maybe for weight reasons a non-aquatic mammal, like a giraffe-sized human and whether that would have any impact on further intelligence.
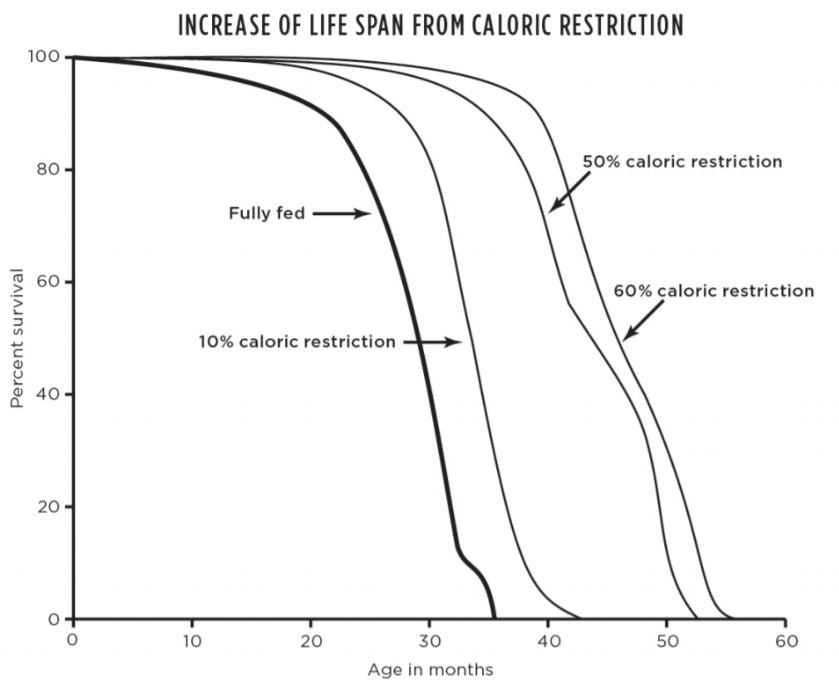
Aging and dying are also closely related to metabolic scaling in organisms. Even if you cured all heart and cardiovascular disease life expectancy at birth would increase by only six years. If you cured all cancer life expectancy at birth would increase by three years - while at age 65, only by two years. This however drives at the conceptual divide between the pain and suffering of the individual who gets cancer, and the statistical average expressed by the theory. Similarly caloric restriction might increase the life span of biological entities by slowing metabolism down. Birth, growth and death are all governed by the same dynamics connected to metabolic rate and the structure of networks.
Did you like this issue of thinkthinkthink? Consider sharing it with your network: Share
One Book
Scale: The Universal Laws of Growth, Innovation, Sustainability, and the Pace of Life in Organisms, Cities, Economies, and Companies by Geoffrey West
I guess this one is self-explanatory. My suggestion is you skip my summary and read the book. It unifies concepts as varying as urban infrastructure, hydrostatic pressure or the cardiovascular system through simple scaling rules - that while intuitive - have rarely been quantitatively analyzed. The chapter on cities is especially compelling - a must read for any urban planner. It has a similar approach to Order Without Design by Alain Bertaud - but while Bertaud attempts a more functional, zoomed-in understanding of the rules and formulas that drive mobility and housing, West gives a comparative coarse-grained perspective on the quantifiability of the urban condition.
Three Links
Noam Chomsky on the future of Deep Learning by Andrew Kuo Language, Ethics, Chomsky & Neural Networks
Will coronavirus cause a big city exodus? by Henry Overman and Max Nathan On cities & pandemics
Drones are poised to reshape home design by Beth DeCarbo How the on-demand delivery economy might influence architecture.
Five Tweets
“Capitalism’s grow-or-die imperative stands radically at odds with ecology’s imperative of interdependence & limit. The two can no longer coexist with each other.
— Dr. Lucky Tran (@luckytran) December 12, 2020
Either we will establish an ecological society or society will go under for everyone"
― Ursula Le Guin pic.twitter.com/eiNOf2HqQl
From adolescence to old age: who do we spend our time with?
— Max Roser (@MaxCRoser) December 11, 2020
→ From @EOrtizOspina’s new @OurWorldInData post: https://t.co/ykXNfNx2Ju pic.twitter.com/uKB2FEN5vh
'The innovation systems map demonstrates that each lever is embedded in the lever above it' https://t.co/i86i21kMd8 #innovation #Policy #Systems pic.twitter.com/Q41sNC14dq
— Arnaldo Pellini (@ArnaldoPellini) December 10, 2020
We may be a bit biased, but the coolest street view is 250 miles above Earth! Check out the inside of the @Space_Station where all of the microgravity science happens. https://t.co/7Ow2WZPtbd
— ISS Research (@ISS_Research) May 19, 2020
Hello Urbanist Twitter friends: here’s my Christmas #UrbanistBookList Which titles have I missed? pic.twitter.com/FakUR1OA3F
— Ludo Campbell-Reid (@LudoCReid) December 15, 2020
This was the thirteenth issue of thinkthinkthink - a periodic newsletter by Joni Baboci on cities, science and complexity. If you really liked it why not subscribe?